Pearson Correlation Calculator
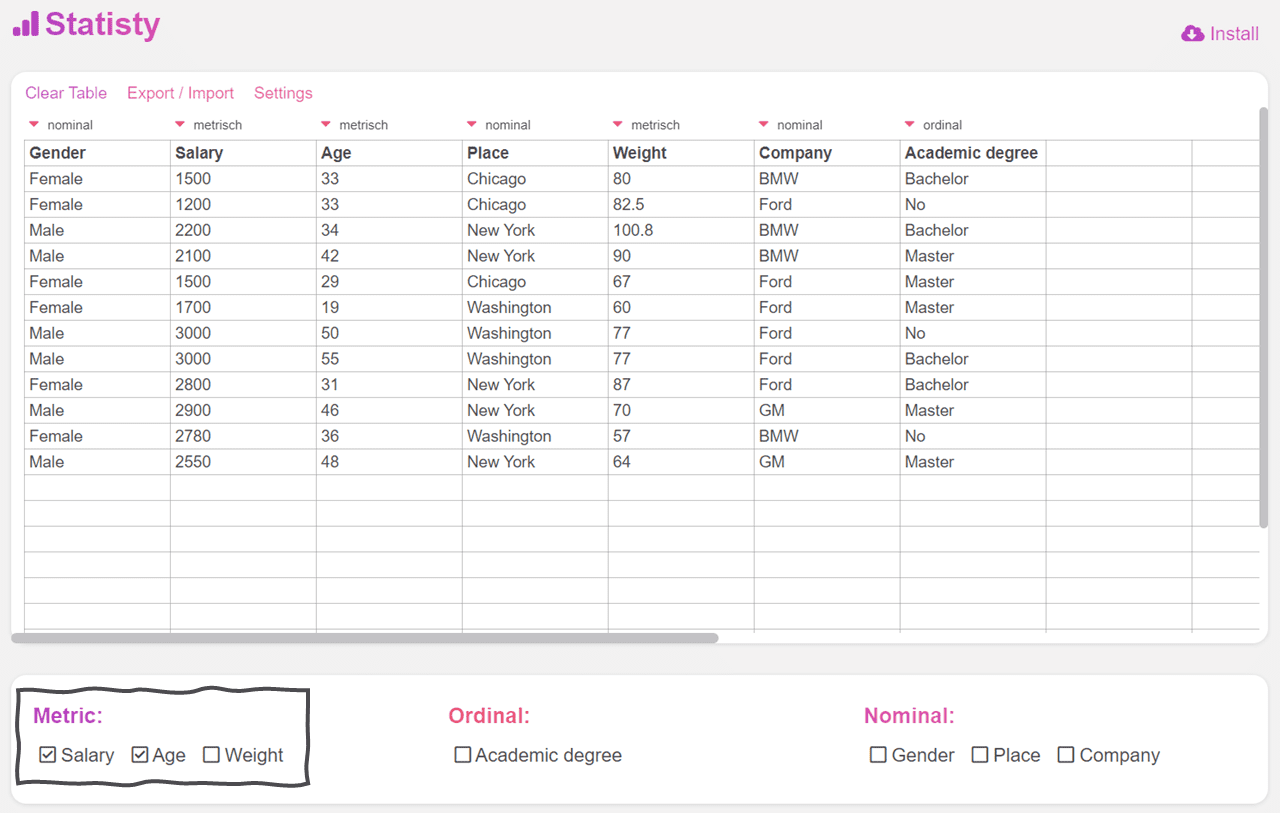
The Pearson correlation coefficient, often symbolized as r, is a fundamental concept in the world of statistics, particularly when we wish to understand the linear relationship between two continuous variables. To calculate a person correlation, simply select two metric variables.

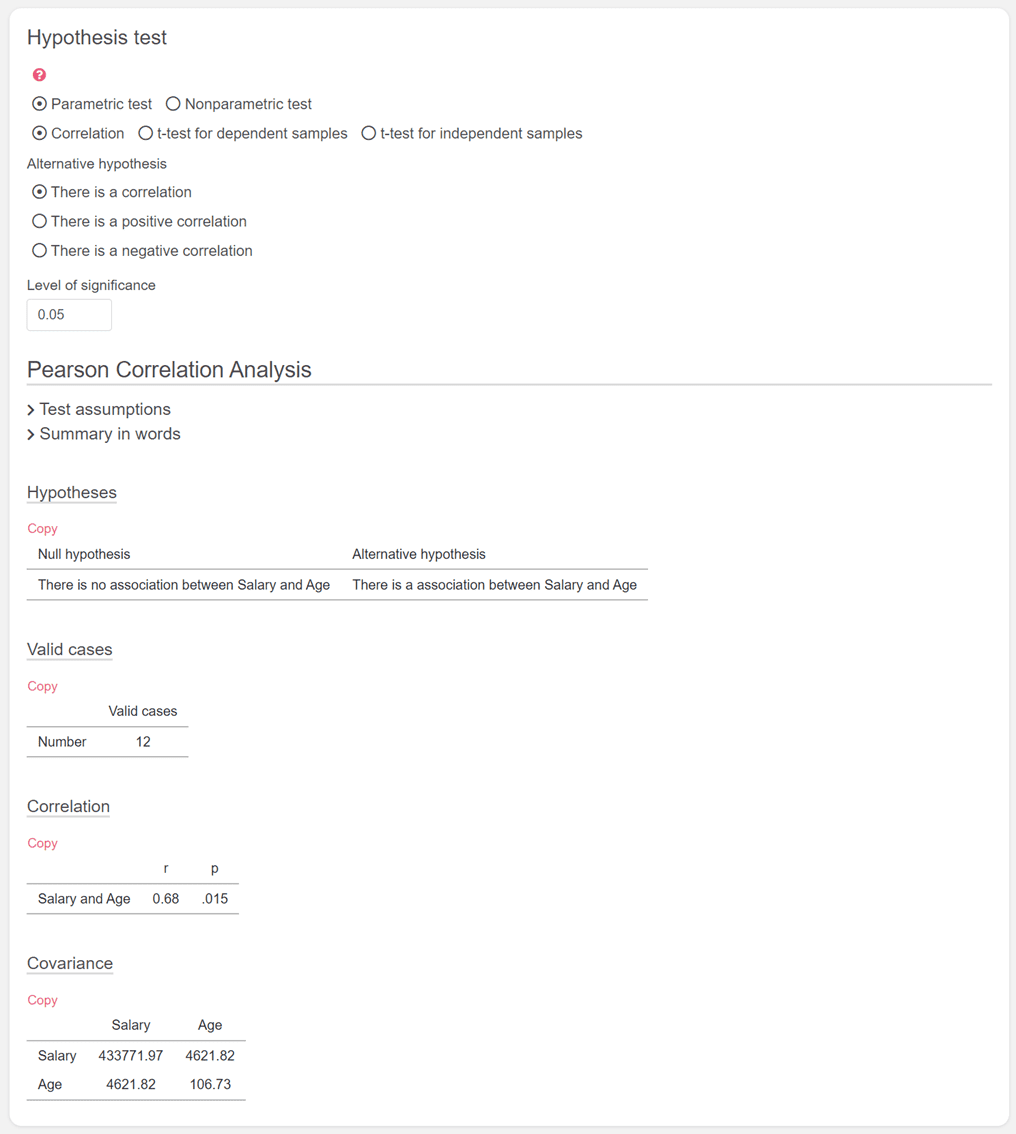
Afterwards you will get all relevant results clearly displayed! First you can read the hypotheses, then you can see how many cases were used and finally you can read the calculated correlation coefficient and the p-value.

If you like, you can also calculate the Spearman's rank Correlation.
What is the Pearson Correlation Coefficient?
The Pearson correlation coefficient measures the linear association between two variables. Its value ranges between -1 and 1:
- r = 1 implies a perfect positive linear relationship.
- r = -1 indicates a perfect negative linear relationship.
- r = 0 suggests that there is no linear relationship.
Why Opt for Pearson Correlation?
- Linearity: Ideal for examining the linear relationship between two continuous variables.
- Sensitivity: Capable of detecting even weak linear relationships.
- Versatility: Widely used in various fields like psychology, finance, physics, and more.
Pearson Correlation Calculator:
Follow these steps to compute the Pearson correlation coefficient for your data:
- Inputs: Collate your paired data sets, let's say X and Y.
- Compute Means: Determine the mean of X (X mean) and the mean of Y (Y mean).
- Deviation Calculation: For each data point in X and Y, find the difference from their respective means.
- Product of Deviations: Multiply the deviations of X and Y for each paired data point.
- Square the Deviations: Calculate the square of deviations for X and Y.
-
Compute the Correlation using the formula:
r = Σ (Xi - X̄)(Yi - Ȳ) / √(Σ (Xi - X̄)^2 Σ (Yi - Ȳ)^2)
Where:
- Xi and Yi are individual data points.
- X̄ and Ȳ are the mean Values from X and Y
Example:
Imagine you have the following paired data:
| X | Y |
|---|---|
| 5 | 15 |
| 7 | 20 |
| 8 | 23 |
Computing mean and deviations:
X̄ = 6.67
Ȳ = 19.33
Using the formula, you can then compute the Pearson correlation coefficient for this data.
Conclusion:
The Pearson correlation coefficient is a powerful tool for discerning linear relationships between two datasets. An understanding of this concept can provide a strong foundation for more complex statistical analysis.
Do remember, while r can measure the strength and direction of a linear relationship, it does not imply causation. Always ensure the context of your data is taken into account when interpreting results.
If you ever need to swiftly calculate the Pearson correlation without manual computation, numerous statistical software solutions and online calculators are available for your convenience.