Paired t-Test Calculator
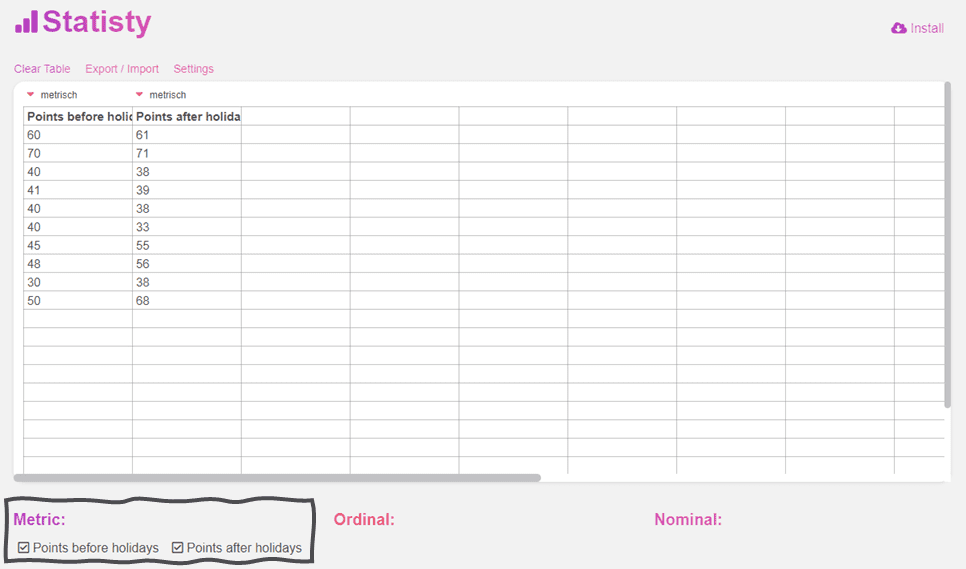
To calculate an paired sample t-Test online just select two metric Variables. Statistiy then automatically calculates the relevant descriptive statistics, the paired t-test and outputs relevant graphs.

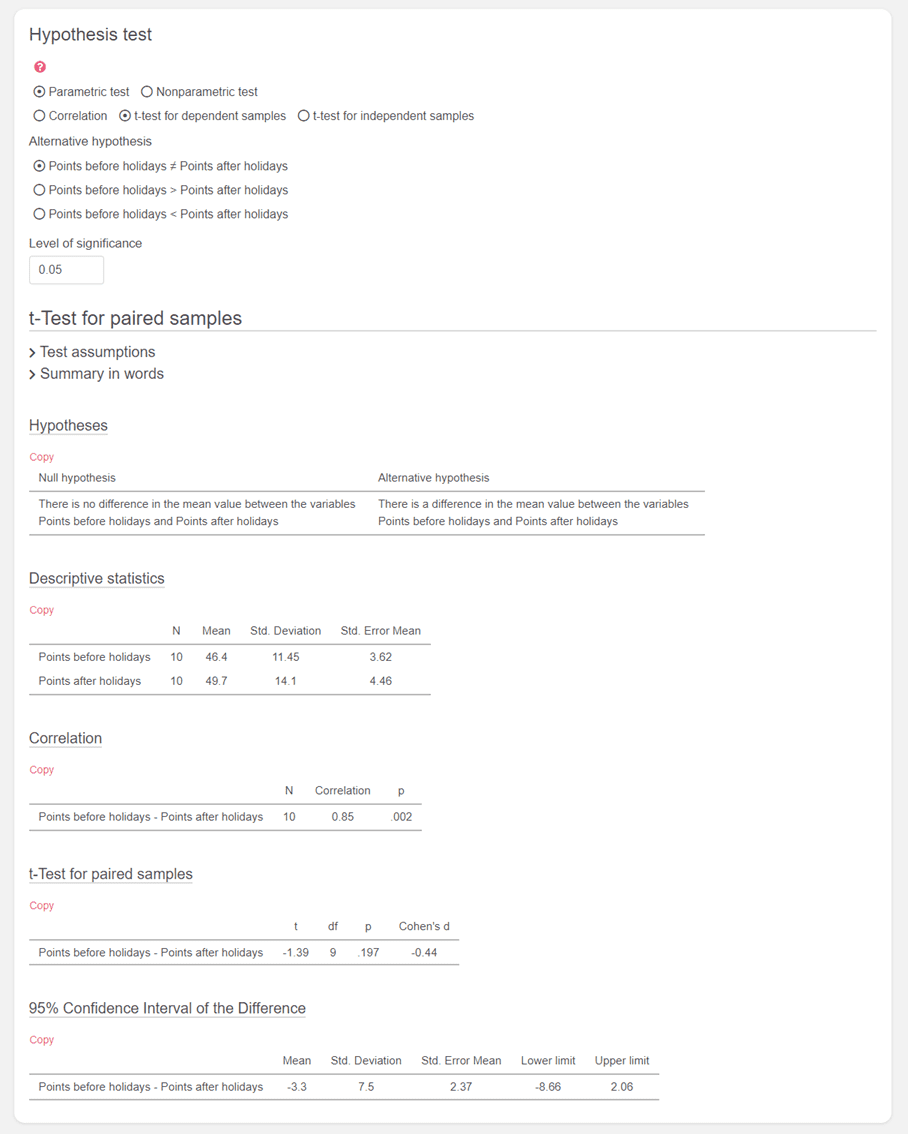
The results of the calculated paired sample t-Test (dependent t-test) are then displayed.

If your data are not paired (dependent), you can calculate the independent t test online.
Paired t-Test
A paired t-test is a statistical hypothesis test that is used to compare the means of two related samples to determine if there is a significant difference between them. It is also known as a dependent t-test or a paired samples t-test.
The paired t-test is used when the two samples being compared are not independent, but instead, they are matched or paired in some way. The pairing could occur when the same subjects are measured before and after an intervention, or when two different measurements are taken on the same subjects under different conditions.
The key assumption of the paired t-test is that the differences between the paired observations are normally distributed. The test calculates the mean difference between the paired observations and compares it to zero to determine if there is a significant difference.
The hypothesis for a paired t-test can be stated as follows:
- Null hypothesis (H0): There is no significant difference between the means of the paired samples.
- Alternative hypothesis (H1): There is a significant difference between the means of the paired samples.
Paired t-test Hypotheses
The dependent t-test, also known as the paired-samples t-test, is a statistical procedure used to determine if there is a significant difference between the means of two related groups. The groups are "related" because they are matched or paired in some way, often being the same individuals measured at two different times or under two different conditions.
There are typically two main hypotheses in the dependent t-test:
-
Null Hypothesis (H0): There is no significant
difference between the paired observations. This means that the mean of the
difference between the paired observations is zero.
H0: μd = 0
Where μd is the mean of the differences between paired observations. -
Alternative Hypothesis (Ha or H1): There is
a significant difference between the paired observations.
Ha: μd ≠ 0
One-tailed hypotheses
The upper hypotheses result from an undirected test. The "one-tailed" aspect of the test indicates that the test is examining the difference in a specific direction. This is different from a two-tailed test, which looks for differences in both directions. For a one-tailed test, you are specifically testing either:
The alternative hypotheses for the one-tailed case (left-tailed or right-tailed) are:
-
Left-tailed: Whether the mean of group A is significantly greater than the
mean of group B
Ha: μd < 0 -
Right-tailed: Whether the mean of group A is significantly less than the
mean of group B
Ha: μd > 0
p-Value
If the p-value resulting from the t-test is below a specified significance level (commonly 0.05), you would reject the null hypothesis in favor of the alternative hypothesis, indicating a significant difference between the paired groups. If the p-value is above the significance level, you would fail to reject the null hypothesis, suggesting no significant difference between the paired groups based on the data collected.
The test generates a t-value and a p-value. The t-value measures the difference between the means in terms of standard error units, while the p-value indicates the probability of obtaining the observed difference or a more extreme difference if the null hypothesis is true.
If the p-value is below a predetermined significance level (commonly 0.05), the null hypothesis is rejected, suggesting that there is a significant difference between the means of the paired samples. If the p-value is above the significance level, the null hypothesis is not rejected, indicating that there is insufficient evidence to conclude a significant difference.
Assumptions for Paired Samples T-test
Independence: The paired observations are independent of each other. In this case, the independence assumption refers to the differences between paired observations being unrelated.
Normally Distributed Differences: The differences between paired observations should be approximately normally distributed.
No Outliers: The presence of extreme outliers in the differences can affect the validity of the t-test.
Calculate the Effect Size for a Paired Samples T-Test
To calculate the effect size for a paired samples t-test, you can use the Cohen's d formula for paired data. Cohen's d measures the standardized difference between the means of two paired groups, and it quantifies the effect size. Here's how to calculate Cohen's d for a paired samples t-test:
Cohen's d for Paired Samples T-Test:
-
Calculate the Mean Difference (MD):
Find the mean difference between the paired samples (before and after treatment, for example).
MD = Mean of Sample 1 - Mean of Sample 2
-
Calculate the Standard Deviation of Differences (SD):
Compute the standard deviation of the differences between paired samples.
SD = Standard Deviation of (Sample 1 - Sample 2)
-
Calculate Cohen's d:
Use the following formula to calculate Cohen's d:
Cohen's d = MD / SD
Cohen's d represents the effect size, and its magnitude can be interpreted as follows:
- Small effect size: d ≈ 0.2
- Medium effect size: d ≈ 0.5
- Large effect size: d ≈ 0.8
Here's a step-by-step example using hypothetical data:
Suppose you have measured the performance of a group of students before and after a tutoring program. The scores are as follows:
Before: [60, 65, 70, 55, 58] After: [75, 80, 85, 70, 72]
1. Calculate the Mean Difference (MD):
MD = Mean(Before) - Mean(After)
MD = (60 + 65 + 70 + 55 + 58)/5 - (75 + 80 + 85 + 70 + 72)/5 MD = (308 - 382)/5
MD = -74/5 MD = -14.8
2. Calculate the Standard Deviation of Differences (SD):
SD = Standard Deviation(Before - After)
SD = Standard Deviation([60-75, 65-80, 70-85, 55-70, 58-72])
SD = Standard Deviation([-15, -15, -15, -15, -14]) SD = √[(225 + 225 + 225 + 225 + 196)/5]
SD = √(1096/5) SD ≈ √219.2 SD ≈ 14.8
3. Calculate Cohen's d:
Cohen's d = MD / SD Cohen's d = -14.8 / 14.8 Cohen's d = -1.0
In this example, Cohen's d is approximately -1.0, indicating a relatively large effect size. The negative sign suggests that the tutoring program led to a decrease in scores.
Why Use the Paired t-test Calculator?
Simplicity: No need for extensive mathematical knowledge. Input your data, and get the results.
Accuracy: Built on reliable algorithms, this calculator ensures precision.
Time-Efficiency: Manual calculations can be cumbersome. This tool saves time, delivering results promptly.
If you like you can also have a look at the paired t-test calculator on DATAtab.
How to Use the Calculator
Input Data: Enter the paired data sets into the respective fields.
Set Significance Level: Typically set at 0.05, but you can adjust based on your study's requirements.
Wrapping Up
The paired t-test calculator is a vital tool for anyone working with related groups of data. It streamlines the analysis process, offering quick, accurate results. Whether you're a student, researcher, or educator, this tool will undoubtedly enhance your statistical arsenal.
Discover the power of the paired t-test calculator today and dive deeper into the world of data analysis!
The Rise of Online Calculators
Traditional statistical software, while powerful, often comes with a learning curve and can be expensive. Enter the era of online calculators – simple, user-friendly, and often free. Among them, the paired t test online calculator stands out as a boon for researchers and students alike.
Key Features of Online Paired T-Test Calculators:
- User-Friendly Interface: Simply input your data, and with a click of a button, you can get the t-statistic and p-value.
- Quick Results: No more manual calculations or wrestling with software. The online paired t test gives results in seconds.
- Accessible from Anywhere: With internet connectivity, you can perform the test, making research tasks more manageable.
Spotlight on the Related Samples T-Test Calculator
The "related samples t-test calculator" is another term often used for the paired t-test calculator. Like its counterpart, it's designed to analyze data from related samples or paired samples, providing accurate and quick results.