Mann-Whitney U-test calculator
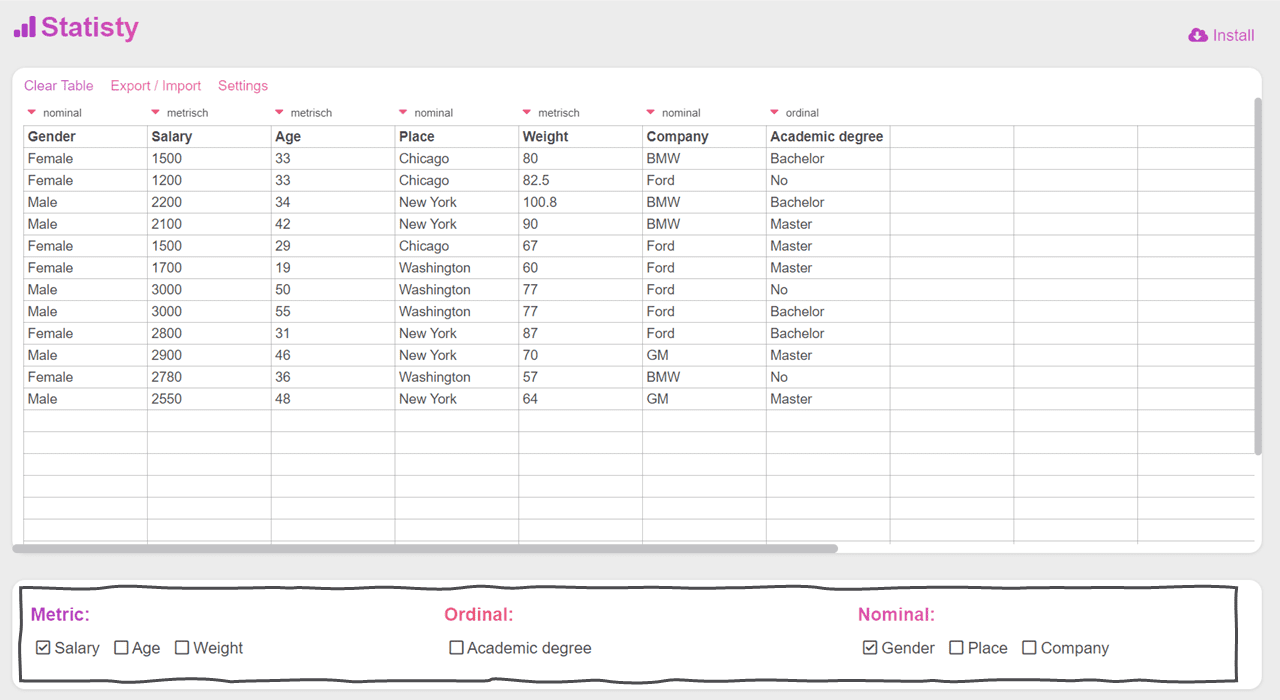
To calculate a Mann-Whitney U test online, select a metric variable and a nominal variable with two values. Then click Nonparametric again.

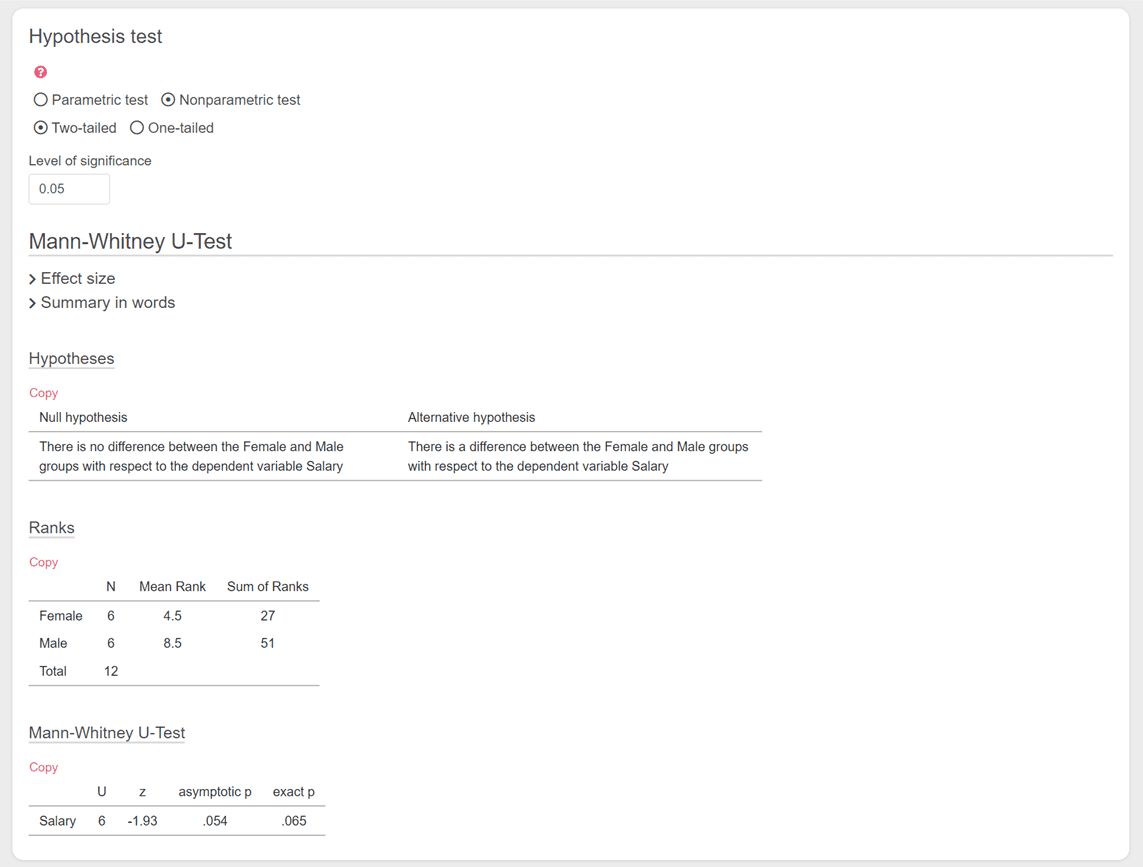
The results of the Mann-Whitney U-test are then clearly displayed. Among other things, you can read off the hypotheses and of course the calculated p-value.

You can calculate a Mann-Whitney U test if the conditions for calculating an independent t-test are not met. If your variable has more than two values, you can calculate the Kruskal-Wallis test online.
Mann-Whitney U-test
The Mann-Whitney U test is a non-parametric statistical test used to compare two independent groups to determine if there are any significant differences between their distributions. It is an alternative to the independent two-sample t-test, which assumes that the data is normally distributed and has equal variances. The Mann-Whitney U test does not require these assumptions and is more appropriate when dealing with ordinal or non-normally distributed data.
Here's how the Mann-Whitney U test works:
- Data: You start with two independent samples, each containing observations from a different group or condition.
- Ranking: Combine the data from both groups and rank them in ascending order, regardless of the group to which they belong.
- Calculation of U: Calculate the sum of ranks for each group separately. The U statistic is the smaller of these two sums. It represents the number of times observations from one group are ranked higher than observations from the other group.
- Comparison with Critical Value: Compare the calculated U value with critical values from the Mann-Whitney U distribution table (or use a statistical software or calculator to obtain the p-value). The critical value or p-value will indicate whether there is a significant difference between the two groups.
- Interpretation: If the p-value is below the significance level (often denoted as α), typically 0.05, then you can reject the null hypothesis and conclude that there is a significant difference between the two groups. If the p-value is greater than α, then there is insufficient evidence to reject the null hypothesis, and you cannot claim a significant difference.
Mann-Whitney U-test Assumptions
The Mann-Whitney U-test, also known as the Wilcoxon rank-sum test, is a non-parametric test used to compare two independent samples to determine if they come from the same distribution. Here are the key assumptions associated with the Mann-Whitney U-test:
- Independence of Observations: The two samples being compared must be independent of one another. This means that the observations in the first sample do not influence the observations in the second sample, and vice versa.
- Ordinal Data: The data should be at least ordinal, meaning that data points can be ranked in a specific order. The Mann-Whitney U-test is used to compare the ranks of data points across two groups. While the test can be applied to ordinal, interval, or ratio data, it does not assume that the data is normally distributed or that the variances are equal in the two groups.
- Continuity Assumption: The Mann-Whitney U-test assumes continuous data, meaning that the probability of ties (equal ranks) is small. In the presence of many tied ranks, corrections to the standard test statistic might be needed.
- Homogeneity of Shape: While the test does not assume that the two distributions have the same shape, the interpretation of the test results can be more straightforward when this assumption holds. If the shapes are different, then a significant result could be due to differences in shape rather than a shift in the median (or location).
- Random Sampling: The observations should be randomly sampled from the populations they represent.
Hypotheses of the Mann-Whitney U-test
The Mann-Whitney U-test, or the Wilcoxon rank-sum test, is a non-parametric test that compares two independent samples to determine if they come from the same population or if one population's median (or mean rank) is greater than the other's. The hypotheses for the Mann-Whitney U-test are framed in terms of the ranks of the observations.
Null and Alternative Hypotheses
-
Null Hypothesis (H0):
- The distribution of the ranks is the same across the two groups. In other words, there is no difference in the distribution of the two groups being compared. If we consider medians, the null hypothesis states that the median of group A is equal to the median of group B.
-
Alternative Hypothesis (H1):
- The distribution of ranks is different between the two groups. Depending on the context and the direction of the expected difference, the alternative hypothesis can be two-sided (non-specific about direction), one-sided (greater than), or one-sided (less than). Specifically:
- Two-sided: The distribution of one group is not equal to the other group. The median of group A is not equal to the median of group B.
- One-sided (greater than): The median (or mean rank) of group A is greater than the median (or mean rank) of group B.
- One-sided (less than): The median (or mean rank) of group A is less than the median (or mean rank) of group B.
When you use the Mann-Whitney U-test, you decide which version of the alternative hypothesis to test based on the specific research question or the direction of the expected effect. If you have no specific expectation about the direction, you would typically use the two-sided alternative.
Interpret the results of the Mann-Whitney U-test
Interpreting the results of the Mann-Whitney U-test involves understanding both the statistical significance and the practical significance (or effect size) of the findings. Here's a step-by-step guide on how to interpret the results:
-
State the Null Hypothesis (H₀) and the Alternative Hypothesis (H₁):
- H₀: The distributions of both groups are identical, so that there is a 50% probability that an observation from a value randomly selected from one group exceeds an observation randomly selected from the other group.
- H₁: The distributions of both groups are not identical.
-
Check the p-value:
- The p-value resulting from the Mann-Whitney U-test indicates the probability of observing the given U statistic, or something more extreme, under the null hypothesis.
- If the p-value is less than your chosen significance level (commonly set at 0.05), you reject the null hypothesis in favor of the alternative. This suggests that the distributions of the two groups differ.
- If the p-value is greater than the significance level, you fail to reject the null hypothesis, suggesting there's not enough evidence to say the two groups are different.
-
Consider the U Statistic:
- The U value itself can be compared to critical values from the U distribution (for smaller sample sizes) to determine significance.
- For larger sample sizes, a z-value is typically calculated and used to determine significance.
-
Calculate and Interpret the Effect Size:
- As discussed previously, you can use the formula r = U / (n1 × n2) to calculate the effect size.
- Effect size provides a measure of the magnitude of the difference, which can be particularly useful when the samples are large and even small differences can become statistically significant.
- An r value close to 0 indicates a small effect size, whereas an r value close to 1 indicates a large effect size.
-
Practical Significance:
- Beyond statistical significance, consider the practical implications of your results. Even if a result is statistically significant, it might not have practical importance.
-
Assumptions and Limitations:
- Remember that the Mann-Whitney U-test is a non-parametric test, which means it doesn't assume normality of the data. However, it does assume that observations from both groups are independent.
- It's also worth noting that the Mann-Whitney U-test only tests for shifts in the median, not differences in other measures of central tendency or the shape of the distribution.
Reporting the results of the Mann-Whitney U Test
Reporting the results of the Mann-Whitney U test according to APA (American Psychological Association) style requires presenting key statistics and findings in a clear, concise manner. Here's a general guideline on how to report the results:
-
Specify the Test and Purpose:
- Start by specifying that you performed a Mann-Whitney U test and briefly explain the purpose of the test.
- E.g., "A Mann-Whitney U test was conducted to determine..."
-
Report the U Statistic:
- Clearly report the U statistic value.
- E.g., "U = 105,"
-
Report the Significance Level:
- Indicate the exact p-value obtained.
- If the p-value is less than .001, you can report it as "p < .001."
- If the p-value is, for example, .045, you would report it as "p = .045."
-
Sample Size:
- Mention the sample size of each group.
- E.g., "n1 = 30, n2 = 25."
-
Effect Size (if calculated):
- Report the effect size (like r) and describe its magnitude.
- E.g., "r = .34, indicating a medium effect size."
-
Summarize the Results:
- After presenting the statistics, provide a summary sentence to explain the meaning of the results in the context of your study.
- E.g., "The results suggest that Group A has significantly higher scores than Group B."
Remember, the key to reporting in APA style is clarity and conciseness. Make sure that your audience can easily understand the statistical test you used, the key results, and the implications of these results.
Here's a comprehensive example of how to report the results:
"A Mann-Whitney U test was conducted to compare scores between Group A and Group B. The test revealed a significant difference between the two groups, U = 105, n1 = 30, n2 = 25, p = .045, with a medium effect size, r = .34. The results suggest that Group A has significantly higher scores than Group B."
Calculate the effect size for the Mann-Whitney U-test
Here's how you can calculate the effect size (r) for the Mann-Whitney U test:
- Conduct the Mann-Whitney U test. As part of the test, you'll get a U-statistic (let's call this U).
-
Calculate the effect size using the following formula:
r = U / (n1 × n2)
Where:- U is the U-statistic from the Mann-Whitney U test.
- n1 is the sample size of group 1.
- n2 is the sample size of group 2.
-
Interpret the r value:
- r ranges from 0 to 1.
- r = 0 indicates no effect.
- r = 1 indicates a perfect effect (i.e., there is no overlap between the two groups).
- Values of r in between 0 and 1 provide an estimate of the magnitude of the effect, with larger values indicating a stronger effect.
Another perspective: Alternatively, the effect size can be thought of in terms of the common language effect size statistic, which is the probability that a randomly selected observation from one group is greater than a randomly selected observation from the other group. This can be calculated as U / (n1 × n2), which gives the same value as r as calculated above.
It's important to note that r does not have a straightforward interpretation like Cohen's d for the t-test. Nonetheless, it provides a way to quantify the magnitude of the difference between groups when using the Mann-Whitney U test.