One-way ANOVA Calculator
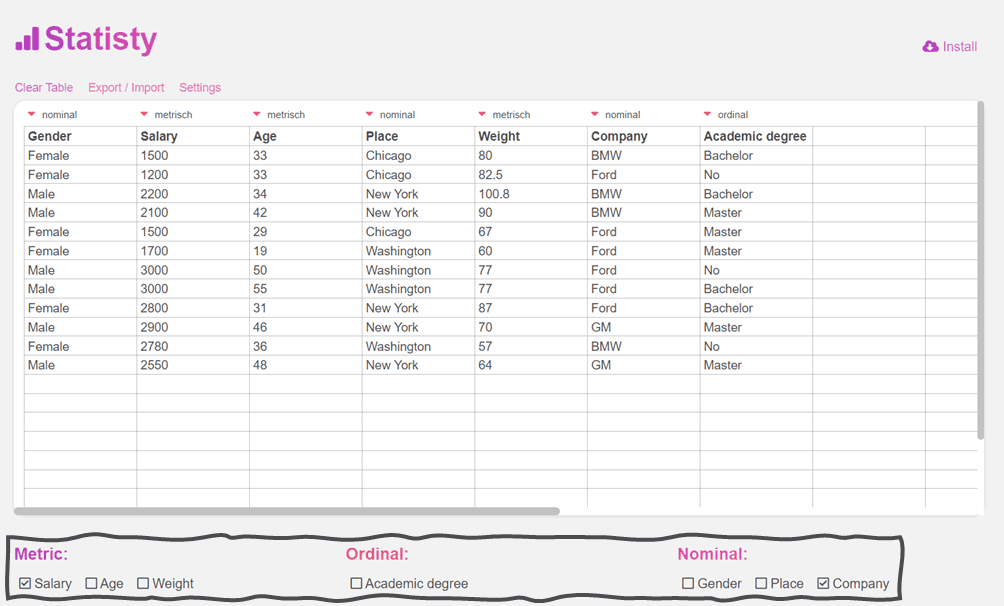
If you want to calculate a one-way ANOVA (one factor ANOVA), simply select a metric variable and a nominal variable with more than two values.

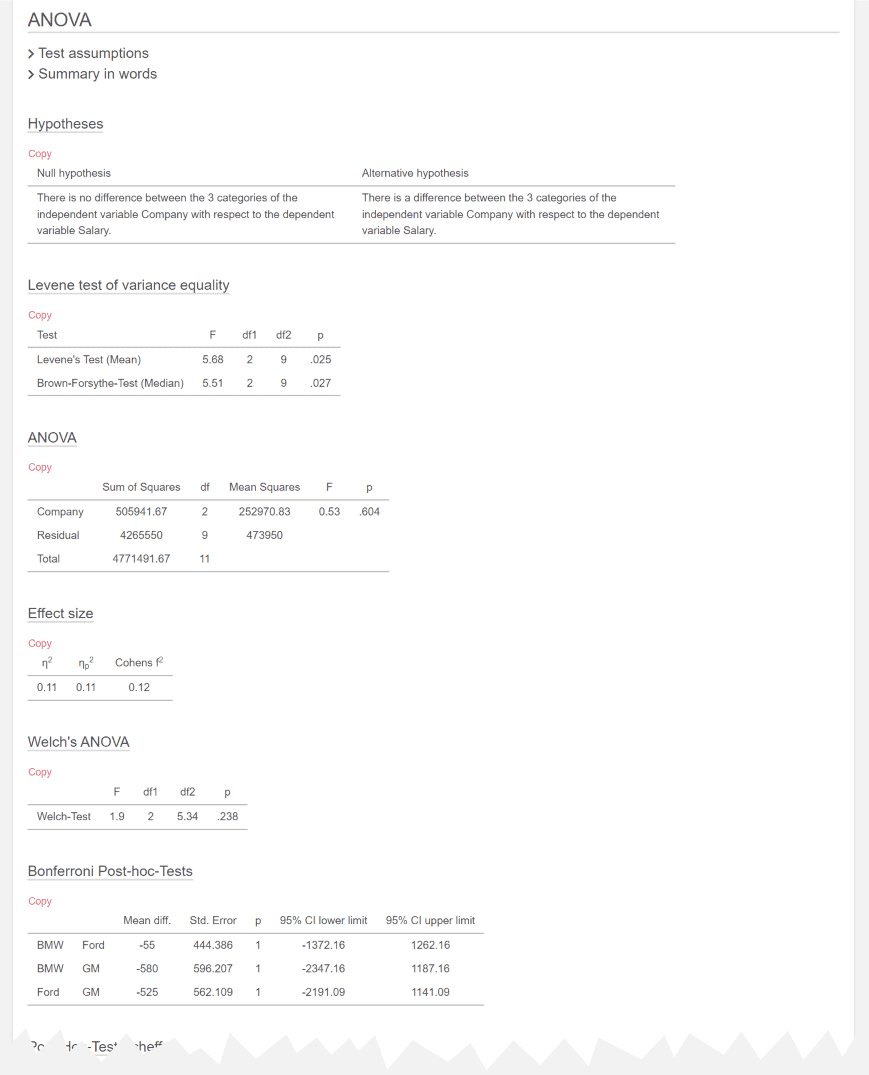
The results are then clearly displayed. First you will see the descriptive statistics and then the results of the calculated ANOVA.

If you select a metric variable and a nominal variable with two categories, an independent samples t-test is automatically calculated. If you select one metric and two nominal variables, a two-way ANOVA will be calculated.
One-way ANOVA
One-way ANOVA (Analysis of Variance) is a statistical method used to compare the means of three or more groups to determine if there are significant differences among them. It is an extension of the two-sample t-test, which is used to compare the means of two groups. The one-way ANOVA allows for the comparison of multiple groups simultaneously.
The hypothesis tested in a one-way ANOVA is whether there is a significant difference in the means of the groups. The null hypothesis states that all group means are equal, while the alternative hypothesis suggests that at least one group mean differs from the others.
One-way ANOVA hypothesis
One-way analysis of variance (ANOVA) is a statistical method used to test for differences among the means of more than two groups. It's particularly useful when comparing three or more group means.
The primary hypotheses for a one-way ANOVA are:
-
Null Hypothesis (H0): The population means of all the groups are
equal. This is essentially saying that there's no difference among the group
means.
Mathematically, if you have k groups, it can be stated as:
μ1=μ2=...=μk (The means of group 1, group 2,..., group k are all equal). -
Alternative Hypothesis (Ha or H1): Not all population means are
equal. This suggests that at least one group mean is different from the others.
It can be stated as:
At least one μ (group mean) is different.
If the one-way ANOVA yields a significant result, it means you reject the null hypothesis in favor of the alternative hypothesis. However, ANOVA does not tell you which specific groups are different from each other. If you find a significant difference, you typically conduct a post-hoc test (e.g., Bonferroni Post-hoc-Tests) to identify where those differences lie.
Assumptions of the one-way ANOVA
To calculate a one-way ANOVA, the data should meet certain assumptions, such as:
- Independence: Observations in one group are independent of observations in other groups.
- Normality: The data within each group are normally distributed.
- Homogeneity of variance: The variability (variance) of the data is approximately the same across all groups.
How to calculate a one-way ANOVA
The one-way ANOVA produces an F-statistic, which is a ratio of the variability between the group means to the variability within the groups. If the F-statistic is large enough and the p-value is below a chosen significance level (often 0.05), then it suggests that there are significant differences among the group means, and we reject the null hypothesis in favor of the alternative hypothesis.
If the ANOVA test indicates significant differences among the group means, follow-up tests like Tukey's post hoc test or Bonferroni correction can be conducted to identify which specific groups differ from each other.
If you have a dependent sample, you can also calculate an analysis of variance with repeated measures.
Calculate the Effect Size for a One-Way ANOVA
To calculate the effect size for a one-way analysis of variance (ANOVA), you can use one of several common effect size measures, depending on the specific context of your analysis. Two of the most commonly used effect size measures for one-way ANOVA are Eta-squared (η²) and Partial Eta-squared (η²_p).
Eta-squared (η²):
Eta-squared measures the proportion of the total variation in the dependent variable that can be attributed to the independent variable (factor). It is a measure of the overall effect size for the entire model.
The formula for Eta-squared is as follows:
η² = SS_between / SS_total
Where:
- SS_between is the sum of squares between groups (variation due to the factor).
- SS_total is the total sum of squares (variation in the dependent variable across all groups).
Partial Eta-squared (η²_p):
Partial Eta-squared measures the proportion of the total variation in the dependent variable that can be attributed to the independent variable while controlling for the effects of other covariates or factors. It provides a more specific effect size estimate for the factor of interest.
The formula for Partial Eta-squared is as follows:
η²_p = SS_between / (SS_between + SS_error)
Where:
- SS_between is the sum of squares between groups (variation due to the factor).
- SS_error is the sum of squares within groups (residual variation).
To calculate these effect sizes, you'll need the output from your one-way ANOVA analysis, which typically includes the sums of squares (SS) for between-groups and within-groups variation. You can then plug these values into the respective formulas.
Once you have calculated Eta-squared or Partial Eta-squared, you can interpret the effect size using general guidelines:
- Small effect size: Typically η² or η²_p < 0.01
- Medium effect size: Typically 0.01 ≤ η² or η²_p < 0.06
- Large effect size: Typically η² or η²_p ≥ 0.06
Keep in mind that these guidelines are general and may vary depending on the field of study and research context. It's important to consider the specific context and significance of your results when interpreting the effect size.
Here's a simplified example using hypothetical data:
Suppose you conducted a one-way ANOVA to compare the test scores of students in three different teaching methods (Method A, Method B, and Method C).
- SS_between = 3000 (sum of squares between groups)
- SS_error = 6000 (sum of squares within groups)
- SS_total = 9000 (total sum of squares)
1. Calculate Eta-squared (η²):
η² = SS_between / SS_total = 3000 / 9000 = 1/3 ≈ 0.3333
2. Calculate Partial Eta-squared (η²_p):
η²_p = SS_between / (SS_between + SS_error)
η²_p = 3000 / (3000 + 6000) = 3000 / 9000 = 1/3 ≈ 0.3333
In this example, both Eta-squared (η²) and Partial Eta-squared (η²_p) have an effect size of approximately 0.3333, indicating a medium-sized effect of the teaching method on test scores.