Independent t-test Calculator
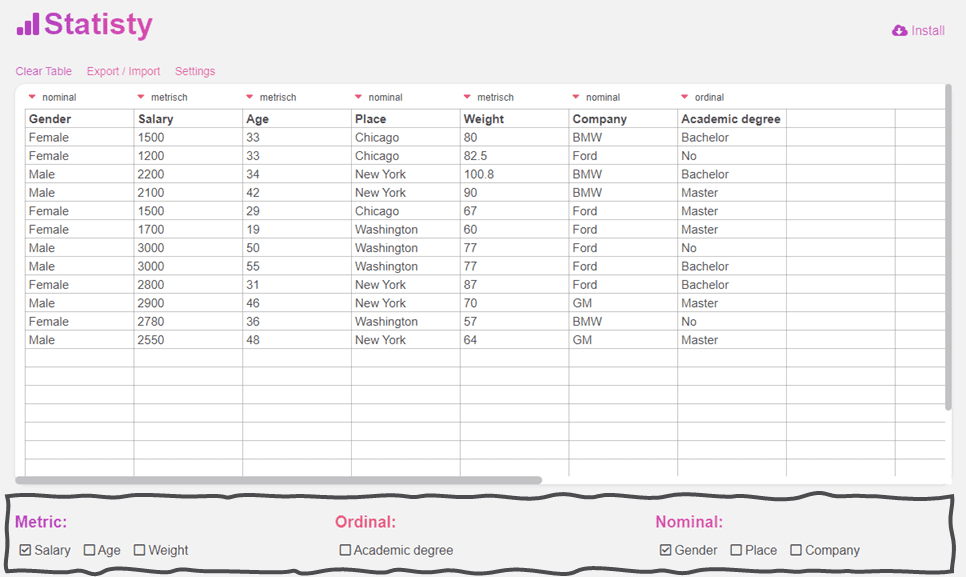
To calculate an independent t-Test online just select one metric Variable and one nominal Variable with two values.

If you want to use your own data, just copy your data into the upper table and make sure that the variable name is in the first row. The results of independent t tests are then displayed clearly.

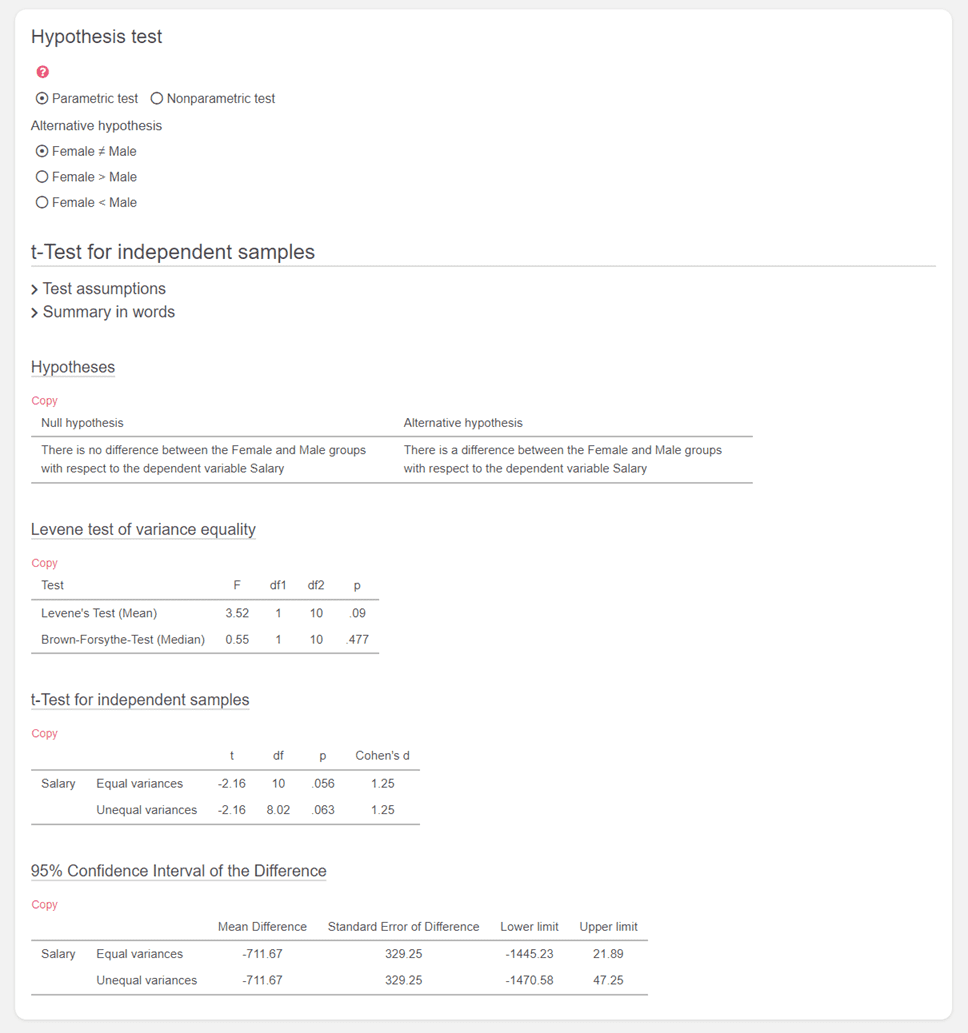
At the beginning of the independent t-test calculator you can choose what your alternative hypothesis is. Then you can test the assumptions for the t-test and you will get the null and alternative hypotheses. Then you get the relative results.
Independent t-Test
An independent t-test is a statistical hypothesis test that is used to determine if there is a significant difference between the means of two independent groups or conditions. It is based on the t-distribution, which is a probability distribution that takes into account the sample size and the variability of the data.
The t-test works by comparing the t-value, which is a measure of the difference between the means, to a critical value based on the desired level of significance (usually denoted as α). The critical value is determined by the degrees of freedom, which depend on the sample sizes of the groups being compared.
If your data are not normally distributed and therefore do not meet the requirements for the independent t-test, you can simply calculate the Mann-Whitney U test online.
Independent T-test Hypotheses
In the independent t-test (also known as the independent samples t-test or two-sample t-test), we compare the means of two independent groups to see if there is a statistically significant difference between them.
The hypotheses for the independent t-test are:
-
Null Hypothesis (H0): The population means of the two
groups are equal. This suggests that there is no significant difference between
the two group means.
[ H0: μ1 = μ2 ] -
Alternative Hypothesis (Ha or H1): This can
be framed in three ways, depending on the research question:
-
Two-tailed test: We are interested in any difference between
the group means, but we don't specify a direction.
[ Ha: μ1 ≠ μ2 ] -
One-tailed test (upper-tailed): We are specifically
interested in whether the mean of group 1 is greater than the mean of group 2.
[ Ha: μ1 > μ2 ] -
One-tailed test (lower-tailed): We are specifically
interested in whether the mean of group 1 is less than the mean of group 2.
[ Ha: μ1 < μ2 ]
-
Two-tailed test: We are interested in any difference between
the group means, but we don't specify a direction.
When conducting an independent t-test, you'd choose the form of the alternative hypothesis based on your research question or specific hypothesis. After performing the test, if the test statistic (t-value) is found to be in the critical region (typically using a significance level like 0.05), you'd reject the null hypothesis in favor of the alternative hypothesis. If the t-value is not in the critical region, you'd fail to reject the null hypothesis, indicating that you didn't find enough evidence to suggest a significant difference between the two group means.
How to calulate an independent t-test
- Formulate the null hypothesis (H0) and the alternative hypothesis (H1). The null hypothesis typically assumes that there is no significant difference between the means of the two groups, while the alternative hypothesis assumes that there is a significant difference.
- Collect data from the two groups being compared, ensuring that the samples are independent and representative of the populations being studied.
- Calculate the sample means (x̄1 and x̄2), the sample standard deviations (s1 and s2), and the sample sizes (n1 and n2) for each group.
- Compute the t-value using the formula: t = (x̄1 - x̄2) / sqrt((s1^2/n1) + (s2^2/n2))
- Determine the degrees of freedom for the t-distribution, which is calculated using the formula: df = n1 + n2 - 2
- Compare the calculated t-value to the critical value from the t-distribution table (or use statistical software) at the desired level of significance (α).
- If the calculated t-value exceeds the critical value (i.e., it falls within the rejection region), then the null hypothesis is rejected, indicating that there is a significant difference between the means. If the calculated t-value does not exceed the critical value (i.e., it falls within the non-rejection region), then the null hypothesis is not rejected, suggesting that there is no significant difference between the means.
The p-value is important to reported in a independent samples t-tests, representing the probability of obtaining a difference as extreme as the observed one, assuming the null hypothesis is true. If the p-value is below the chosen significance level (α), typically 0.05, then the null hypothesis is rejected.
Calculate Independent t-test online
Therefore, to calculate an independent t-test online, you only need two independent samples. The samples should be normally distributed. Then simply copy the data into the table above, making sure that the first row of variables contains the name! To calculate a paired samples t-test, simply select two metric variables.
Assumptions for Independent Samples T-test
Independence: The observations in each group are independent of each other. This means that the values in one group are not influenced by or related to the values in the other group.
Normally Distributed Data: The data in each group should be approximately normally distributed. If the sample size is large enough (typically >30 observations in each group), the t-test can be robust to moderate deviations from normality. However, for smaller sample sizes, normality assumption becomes more critical.
Homogeneity of Variance: The variances of the two groups should be approximately equal. This assumption is known as homoscedasticity. Unequal variances between groups can affect the accuracy of the t-test.
Calculate the Effect Size for the Independent t-Test
The effect size for an independent t-test is a measure of the magnitude or strength of the difference between the means of two independent groups. It provides information about the practical significance of the observed difference, which can be valuable in addition to the statistical significance determined by the t-test. There are several common effect size measures for independent t-tests, and two of the most widely used ones are Cohen's d and Hedges' g.
Cohen's d:
Cohen's d is a standardized measure of effect size that expresses the difference between the means in terms of standard deviation units.
The formula for Cohen's d is as follows:
Cohen's d = (M1 - M2) / S_pooled
Where:
- M1 is the mean of Group 1.
- M2 is the mean of Group 2.
- S_pooled is the pooled standard deviation, calculated as:
S_pooled = √((s1^2 + s2^2) / 2)
Where s1 and s2 are the standard deviations of Group 1 and Group 2, respectively.
Hedges' g:
Hedges' g is similar to Cohen's d but includes a correction factor for small sample sizes. It's useful when you have unequal group sizes or small sample sizes.
The formula for Hedges' g is as follows:
Hedges' g = (M1 - M2) / S_pooled * (1 - (3 / (4 * (N1 + N2) - 9)))
Where:
- M1 is the mean of Group 1.
- M2 is the mean of Group 2.
- S_pooled is the pooled standard deviation, calculated as described above.
- N1 is the sample size of Group 1.
- N2 is the sample size of Group 2.
Once you have calculated Cohen's d or Hedges' g, you can interpret the effect size using general guidelines. Cohen's original guidelines suggest that:
- Small effect size: d ≈ 0.2
- Medium effect size: d ≈ 0.5
- Large effect size: d ≈ 0.8
However, it's important to note that the interpretation of effect size can be context-dependent and may vary by field or research area. In some cases, even a small effect size can be practically significant, while in others, a large effect size may not have much practical relevance. Therefore, it's essential to consider the specific context of your study when interpreting the effect size.
Dive Deep into Data with the Independent t-test Calculator
The statistical realm can seem intimidating, with its barrage of numbers and terms. But when armed with the right tools, it becomes a fascinating world to explore. Introducing the independent t-test calculator - a beacon for those navigating the seas of independent data sets!
Decoding the Independent t-test
Before we delve into the intricacies of the calculator, let's decode the basics. The independent t-test, often referred to as the two-sample t-test, determines whether there's a significant difference between the means of two unrelated groups. For instance, comparing the exam scores of students from two separate classes is a fitting application of this test.
Why Choose the Independent t-test Calculator?
- Efficiency: Bypass time-consuming manual calculations and swiftly gain insights.
- Accuracy: Harness the power of precise algorithms to ensure error-free results.
- User-friendly: Designed with simplicity in mind, the tool is accessible for novices and pros alike.
How to Use Our Calculator Efficiently
- Enter Data: Populate the given fields with the data sets for both groups.
- Select Significance Level: Commonly set at 0.05, but can be tweaked based on your research needs.
- Compute: Hit 'Calculate' and witness the tool's prowess.
Deciphering the Output
Post-calculation, you'll be greeted with a t-value and a p-value.
- t-value: Signifies the size of the difference relative to the variance within the samples.
- p-value: Denotes the likelihood of observing your specific results (or more extreme) under the assumption that the null hypothesis is true.
A p-value smaller than your chosen significance level means you can reject the null hypothesis, pointing towards a significant difference between the two groups.
Final Thoughts
The independent t-test calculator stands as an indispensable ally for all venturing into the comparison of unrelated groups. For students, researchers, and data enthusiasts, this tool demystifies complex calculations, leading to enlightened data-driven decisions.
Embrace the convenience and clarity of the independent t-test calculator and elevate your analytical journey!